Home Audio Recording For Everyone
Phasellus tincidunt ligula leo, eu tincidunt tortor iaculis sit amet. Morbi iaculis dolor ac dolor gravida iaculis. Suspendisse
Advertise No Matter if You Are Big Or Small
Phasellus tincidunt ligula leo, eu tincidunt tortor iaculis sit amet. Morbi iaculis dolor ac dolor gravida iaculis. Suspendisse
6 Ways Optimize Your Website’s Homepage
Phasellus tincidunt ligula leo, eu tincidunt tortor iaculis sit amet. Morbi iaculis dolor ac dolor gravida iaculis. Suspendisse
Tip for Promoting Your Business and Creating
Phasellus tincidunt ligula leo, eu tincidunt tortor iaculis sit amet. Morbi iaculis dolor ac dolor gravida iaculis. Suspendisse
Designing Effective ER Diagrams: A Step-by-Step Guide
Learn ER diagramming! This guide covers design, principles, & practical techniques for effective database modeling. Build robust systems!
An Introduction to Tableau
In today’s data-driven world, the ability to understand and interpret information quickly and effectively is paramount. Tableau has emerged as a leading data visualization and analysis tool, empowering users to…
An introduction to SSRS
SQL Server Reporting Services (SSRS) is a powerful, server-based reporting platform that allows you to create, deploy, and manage a wide variety of reports. Integrated with the Microsoft SQL Server…
An Introduction to Power BI
Power BI is a powerful business intelligence tool that allows users to visualize and analyze data to gain valuable insights. Creating a Power BI report involves several key steps, starting…
What is SSIS
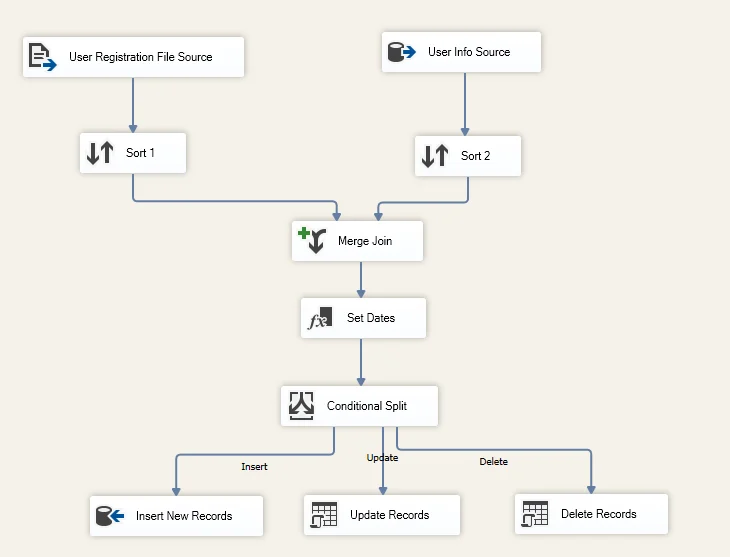
SSIS is an extremely powerful tool by Microsoft for performing ETL. ETL or Extract, Transform and Load is simply the process of consolidating data from multiple sources. The transform part…
Pivot Tables
What are Pivot tables and how they can help. Pivot Tables are great for visualizing your data and see what it’s trying to tell you about your customers which in…


